Business Intelligence and Power BI
This is an exciting time for SharePoint consulting and business intelligence as Microsoft moves more of its offerings into the cloud. The Power BI preview comes with several features for data query, data visualizations, collaboration, and mobility. Additionally there are new add-in components for the Excel client.
 This is Microsoft’s initial foray into cloud based business intelligence but certainly not the last product we will see in this category.
Power BI for Office 365
After creating a new Office 365 account one has to wait for SharePoint online to provision before Power BI is available. Once the provisioning phase is complete a standard Office 365 team site is available.
The choice between installing demo samples and getting to work using one’s own data is given. The demo will install two Excel workbooks into the documents library that provide some excellent Power View charting examples.
Power View has many visualization capabilities that resemble those in Tableau such as bubble charts with color separations for different series and tooltips. Power BI itself is a SharePoint app. Clicking on the app opens up a page with several tiles for queries and workbooks.
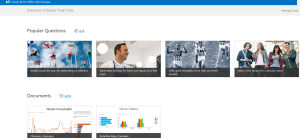
Workbook visualizations have the option to display in Silverlight or via HTML5. The query applications were very interesting in that an English language search is the primary interface.
So a user can request charts, tables, etc to view data a bit like Wolfram Alpha does today. Popular Questions can be saved to Power BI. Finally there is a manage data capability that interfaces with Power Query to generate data for questions.
Power BI has mobile capabilities through Silverlight and HTML 5. Unfortunately I was unable to properly test it with my iPhone because the login page never completed authentication for some reason. The Office 365 login page feels a little unweildy on a small phone. However the mobile interface may work very well on an iPad with its larger screen. On my Surface RT Power BI looks fantastic but I was not able to test the HTML5 version due to slow wireless speeds. The loading and updates tended to be slow on mobile devices especially over wireless so reports may need tweaking for performance in low bandwidth environments.
Collaboration is a major component of Power BI. First of all it is an app hosted on the SharePoint platform. Worksheets are hosted through the existing SharePoint Excel services functionality. These worksheets can be shared with others, discussed, and made part of a collaboration site. Power BI queries can also be shared. Excel charting with collaboration has a lot of potential but user adoption may prove to be challenging, especially as a currently cloud only offering.
Power BI for Excel
Power Pivot and Power View have been available Excel add-ins prior to Power BI. Two additional add-ins come with the preview: Power Map and Power Query.
Power Map is a new add-in that uses DirectX to render 3d visualizations. DirectX 10 or higher and a compliant video card are required. Unfortunately my work laptop is showing its age and was not able to render maps. While Power Pivot and Power Query have their own tabs, Power Map is found next to Power View in the Insert tab.
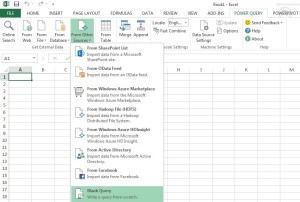
Power Query is a client side ETL tool that can be used as a lightweight SSIS. Data can be loaded from a wide variety of sources including SharePoint, SQL, Web, and even Hadoop. Microsoft is utilizing many of its big data assets such as Bing to make queries a large part of the Power BI environment. Merging and appending sheets are other useful functions. Note that Power Query also interfaces with Azure’s HDInsight. This may be one of the most useful add-ins Excel has seen in a long time.
For more on improving your business intelligence solutions, check out this post from our SharePoint consultant, Kyle, on when to switch from Excel or Access as database solutions…


