
Data Management is an Evolving Strategy
The Upstream industry has proven with the shale boom that innovation is a gamble worth taking. As the industry settles into unprecedented drilling and production going forward, one initiative that can push E&P companies even further is data management.
John Weathington from TechRepublic published an article this week called, “The best big data strategy is the strategy that keeps adapting.” One of his main points was data is only a sample:
“All samples have error, but the most insidious sampling errors introduce themselves while you’re in operation.”
Control Charts and Data Management
One strategy Weathington offers for effectively managing data as it is being collected is the Six Sigma strategy of Control Charts. “What makes it a Control Chart, is that it also monitors the stability or consistency of your average and variance over time.”
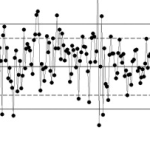 To give an oil and gas example for this, say an Upstream company wants to know the number of days it takes to drill to target depth in a well. A Control Chart would track progress towards this goal.
When you set up the Control Chart, you would create “different rules that determine whether your information is following a stable pattern.” Any dips above and below the mean, such as a delay in drilling or less progress than expected in a given number of days would indicate to the project owner that action should be taken.
Upstream and the Value of Iteration
Data management is important for every organization. For Upstream in particular, using data to iterate and apply learnings to the next well can mean better production with less drilling.
Control Charts have the purpose of ensuring sustainable success over time. Based on this data, it is then possible to evaluate how a given drill bit or rock formation plays into time to target depth. When the company acquires a new property, it is possible to use these previous lessons learned to apply the best techniques to that well.
It may seem overwhelming to decide what factors to control for a given project. For E&P, applying data management principles to controlling drilling times is obvious one because it ties back so clearly to profitability.
Implementing New Data Management Strategies
Once your company has decided to implement new data management control strategies, what roadblocks should you look out for?
1. Information Support
Is the data you need in an easily accessible dashboard? Are reports timely and accurate? How much time do you have to spend manually processing data before it is ready for decision making?
2. Collaboration Tools
How easily can you share information or assets with co-workers? Is versioning a problem? When the owner of a process leaves, is that process documented in such a way that it can be duplicated by someone else?
3. Company Culture
A culture of questioning and innovation is key to making data management control work. Is management open to change and a certain level of risk when the data supports it?
Big Data and Your Well
Big data is one of those buzzwords we hear a lot about without knowing how it applies to our business. Nowhere is the idea of big data more evident than in an active well. The stream of data is constant, and because it is both temporal and geo-located, Control Charts are one very practical way to monitor these multiple factors, their effect, and how improvements can be applied.
For more on making an organizational switch to data based decision making, check out this post on asking the right questions.
Read this blog about Six Sigma and master data management for more on DMAIC…