When it comes to safety for oil and gas, it’s easy to get overwhelmed by the intricacies. A culture of safety needs to filter throughout your organization, and this involves having a plan for how to accomplish this.
Information related to recordable incidents, employee records, certifications, and the like is often spread across multiple disconnected systems, thus making it difficult to draw conclusions or make comparisons.  One good reason to consider creating a strategy for managing and enabling the flow of data across systems is the concept of leading and lagging indicators.
A leading indicator gives you advance notice of an overall shift, for example the number of safety training courses employees have signed up for in the next two months. A lagging indicator generally shows up after a shift has already happened, like an increase in recordable incidents.
The difference between these two benchmarks is that leading indicators give your team a chance to be proactive and make changes if the numbers are moving in the wrong direction. Lagging indicators, on the other hand, leave you in the position of being reactionary, when the opportunity for change has already been lost.
Being intentional about your company’s safety data, by utilizing energy software that brings everything you need to the surface, puts you in the driver’s seat and allows decision making to be both intentional and purposeful. As you work to establish an accountability trail around safety so that it is easy to track what happened, when, and what was done about it, don’t get lost in the minutiae.
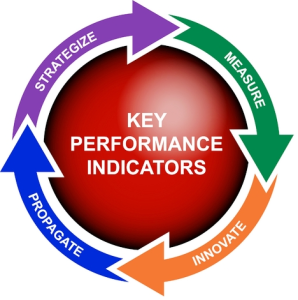
Take the time to examine the data and establish key performance indicators that give you a clear overall idea of where your business is headed. A focus on those leading indicators that can help you see ahead is even better.
For more on developing a data management strategy, check out this blog on energy software. To see key performance indicators in action, check out this post about how one major equipment company has made improvements as a result.

