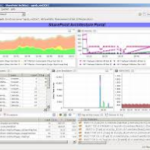
Surfacing Vital Information with SharePoint Dashboards
Your Sharepoint dashboard is similar to the dashboard in your car; it contains all the information that is pertinent to your oil and gas operation so you can easily and quickly find what you need. If you haven’t set up your dashboard, it is important to contact a Sharepoint consulting firm to help you get started on this vital task.
The benefits of having your Sharepoint dashboard fully operational are numerous. Here are the basics of the Sharepoint dashboard to help you get an understanding of why it is so important for your oil and gas business.
One-Stop Shop
 Like I said above, the dashboard is your first stop for information, and should contain relevant items that are used by employees for daily functions. You can include so many things on your dashboard, from forms to stock quotes, maps and plans, and even statistics and budget information.
The dashboard is completely customizable to the needs of your business and to support your daily operations. Your Sharepoint consulting professional can help you determine how you’d like your dashboard to be set up, and what information you need to include.
Drill-Down Menus
The drill-down menu options on the Sharepoint dashboard are one of the most popular among users. You can have many types of drill-downs on your dashboards, with links to information on companies, rigs, wells and assets. Here are a few examples to get your creative juices flowing:
Company –> Field –> Well
Company –> Asset –> Field –> Well
Asset Type –> Field –> Well –> Completion
Area –> Block –> Lease –> Well –> Completion
Plat –> County –> Lease –> Well
As you can see, the options for drill-down menus are endless, and can link to numerous pieces of vital information on current and closed operations.
Filters
Filters are also important when you are setting up your Sharepoint dashboard. You can add filters for operational and non-operational wells. You can also filter by product type, such as oil or gas wells.
Geographical data can be another way to filter information. This allows the user to quickly and easily find the information they need, so they aren’t spending all of their time trying to find what they need to accomplish their mission.
Visualization
Your Sharepoint dashboard also helps users to visualize information so they can gain a better understanding of trends and performance indicators. This will also assist in making business decisions and help further your business reach. You can add charts and graphs to make the information easier to understand and retain.
The Sharepoint dashboard is one of the most important aspects of your Sharepoint site, so it’s important to do it right. Once you have your dashboard set up, it is fairly easy to maintain, and this duty can be handled by an employee in just a few minutes a day.
You will also find that operations run more smoothly when everyone has instant access to the information that they need!
To see how SharePoint dashboards helped one Entrance client accomplish this, check out this case study.

