TIBCO SPOTFIRE CONSULTING
Get pricing, more information, or talk to one of our data visualization experts:
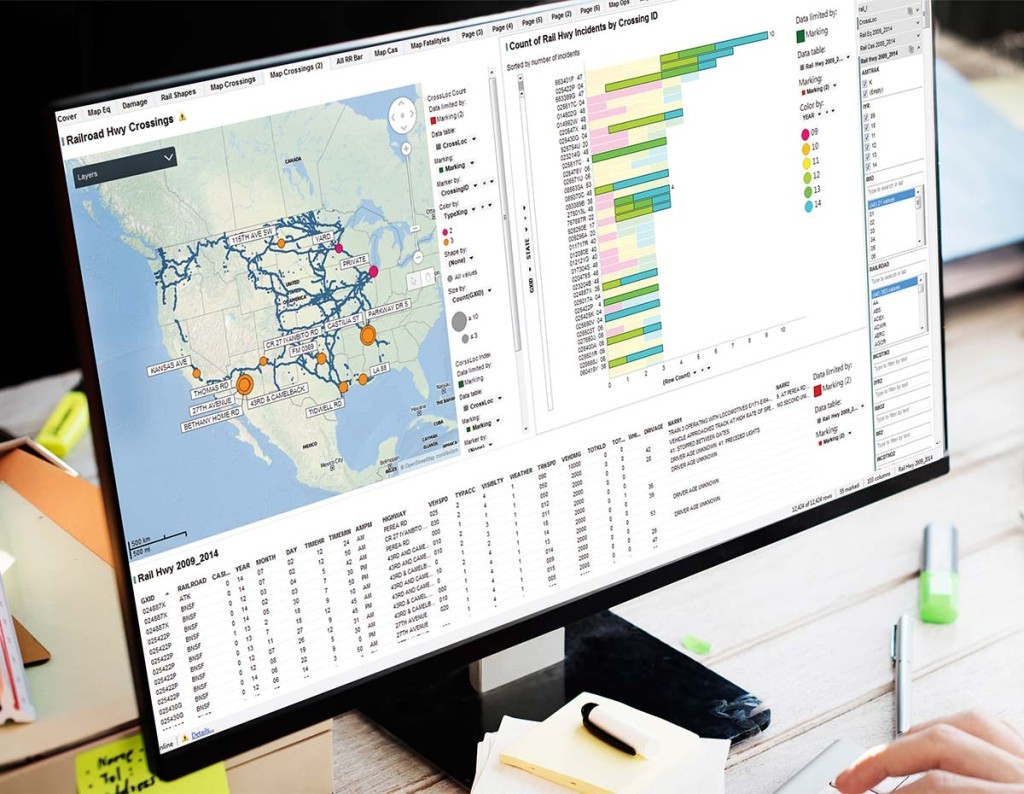
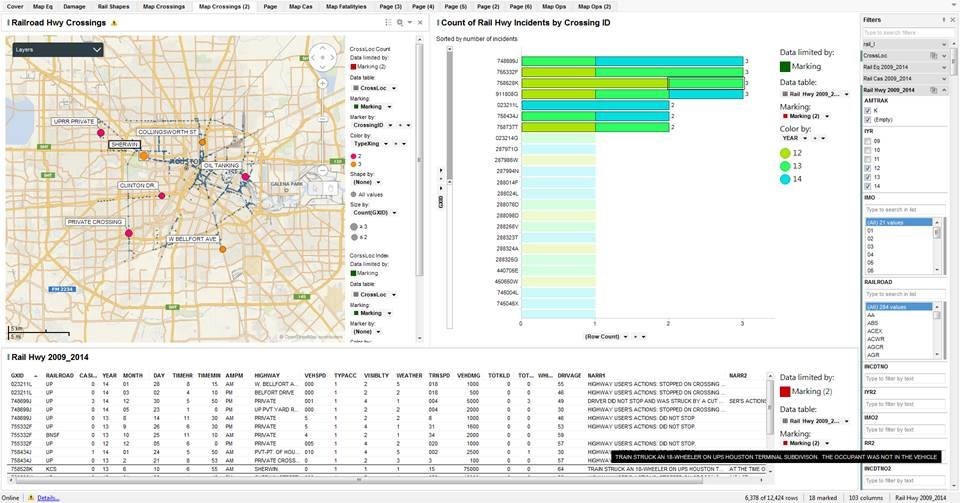
TIBCO Spotfire is a data visualization tool that offers an expansive feature set geared towards engineering clients interested in working with geospatial data and analytics that would be too advanced for other big data visualization tools, such as Tableau, to handle. Unlike newcomer Power BI by Microsoft, Spotfire has been a leader in the interactive visualization space for years.
Spotfire ships with a number of data connectors so that data can be ingested from the typical sources (e.g., SQL Server, Excel) as well as many more niche data stores. The data is loaded into Spotfire’s data server and stored in memory so that even large amount of data can be rendered to the screen with impressive alacrity.
The speed with which data can be visualized on the screen and Spotfire’s ability to sort, group, and filter quickly in response to user input means that interactive visualizations can be created even when they represent massive amounts of data. Prior generations of reporting tools allowed for little interactivity, so consuming the reports was like reading a book, with communication only going one way. This new wave of tools, including Spotfire, is more like a conversation with the author. Questions can be posed and answered immediately without a lengthy process of revision and repackaging.
Spotfire is Just One Member of the TIBCO Business Intelligence Ecosystem

Of note, TIBCO offers a best in class streaming product that can analyze high velocity data as it is recorded, recognize noteworthy patterns, and alert users as needed. As the Internet of Things (IoT) continues to expand, having a streaming data tool that plays well with a visualization tool will be helpful.
If you don’t have Spotfire, you may want to rely on a services provider to help get you off the ground. A typical project would involve deciding on licensing and server location. There are several licensing options, and servers can exist on-premises, on a private cloud, or hosted by TIBCO as part of the Spotfire Cloud offering. If applicable, servers will need to be sized, installed, and configured.
A special consideration when installing an on-premises version of Spotfire is if you want your users to be able to access dashboards while not on your network. If so, our TIBCO consulting team can help with configuring your system to securely allow for this.
Data Modeling and Server Setup
After servers are installed, licenses are assigned, and permissions are configured, the attention of the project team will turn to data. A prioritized list of valuable questions to answer for your users should be compiled, and the data that is needed to answer them should be organized and well understood. For this phase, you will want resources that are experienced Business Analysts to help compile the list of questions and competent database admins to integrate the data with Spotfire. It is also critical to assign one data owner for each business entity modeled by the data. This person can help answer the questions of the developers and verify that the data being visualized in Spotfire is valid.Visualization Creation and Communication
Once data is collected and published, visualization specialists should work in an iterative manner with end users to build dashboards: creating, demoing, incorporating feedback, and so on until the business users are happy. This is also the phase where you will want to communicate with users about the rollout. This communication campaign should continue as more dashboards go live. Users will also need training and resources they can call on if they get stuck.
Tibco Training & Governance
The final phase of the project, the one that leads to full-fledged self-service business intelligence, is enabling your business users to create their own dashboards. You will typically want IT to control the published data sources, but business users, once properly trained, can use them to make their own dashboards. To maintain consistency and compliance with the structure you have set up, system governance should also be a part of this phase of the project. Entrance has a self-service BI governance template that we use to help our clients develop a governance framework suitable to them. From data modeling to server setup to visualization creation to training and governance, Entrance’s Tibco Consulting Team has professionals and processes that can assist you on your journey.Frequently Asked Questions
Why Tibco Spotfire Consulting From Entrance?
As a leader in software and systems integration, Entrance Consulting can help get you started with Tibco Spotfire. From assigning licenses and choosing the hosting solution to setting up servers and providing Spotfire training, Entrance’s Tibco Consulting team has the experience and knowledge to power your data visualization experience.
How Do Spotfire Automation Services Work?
Spotfire’s powerful capabilities allow for a host of automated services requiring no user input. With them, you can run automated analyses and create files effortlessly, and have them emailed at regular intervals. This feature increases productivity by reducing the amount of manual work required.
Is There Tibco Spotfire Integration With Sharepoint?
Tibco Spotfire features a number of data connectors including a robust Sharepoint integration. The business intelligence tool works seamlessly with Sharepoint’s data storage capabilities, as well as a host of other big data tools such as Teradata and databases including Apache Hive and Apache Spark SQL.
What Is The Difference Between Spotfire vs Tableau?
Both platforms are extremely versatile intelligence and analytics software tools that bring visualization to the next level. While each offers a similar suite of features, with a large pool of data connectors to choose from, the difference lies in the background applications you have in place to support them.


