Entrance’s Tableau Consultants built a portal that embedded the Tableau Business Intelligence platform. Tableau allows for quick development and delivery of a solution that can be put in front of stake holders for immediate feedback.
THE CLIENT
The client is a leading producer of premium monocrystalline sand (frac sand), a specialized mineral that is used as a proppant to enhance the recovery rates of hydrocarbons from oil and natural gas wells. The client owns, operates, acquires and develops frac sand reserves and related processing, transportation and distribution facilities.
THE CHALLENGE
The client experienced operational challenges due to a lack of understanding of inventory available for sale at distribution locations. Customer service and sales did not have a good understanding of inventory levels at their distribution locations causing them to miss out on potential higher markup spot sales. In addition, operations and logistics did not have a good way to identify when and how much inventory is expected at their distribution locations causing delays in processing of inventory and inefficient staffing. As is often the case for many of our customers, this customer suffered from poor data and information management. Specifically, the client had multiple silos of information in separate systems that were not integrated and didn’t allow for holistic views of their inventory across their distribution and transportation channel.
Prior to implementation of the solution, the client tracked railcar location, sales data, railcar inventory and silo inventory in 4 disparate systems without any unified reporting or visibility. Many of the systems distributed CSV reports that were emailed to individual consumers, who then would either track the data in personal spreadsheets or have to manually load the information into their ERP system. Because of the manual nature of this process, the consumers of the data spent a part of each day massaging the data to bring single facets of information to light. This configuration limited their ability to make timely and accurate decisions regarding inventory logistics. They also were unable to predict potential issues before they occurred. In the end, these data and information management limitations restricted the clients’ ability to grow distribution and thus revenues, as terminals are not prepared to receive/handle larger shipments (such as unit trains). The client realized they needed a new infrastructure that would enable, rather than hinder their growth. They selected Entrance because of our web portal expertise and proven track record of delivering portal solutions in multiple industry verticals.
THE SOLUTION
Entrance’s Tableau Consultants built a portal that embedded the Tableau Business Intelligence platform. Tableau allows for quick development and delivery of a solution that can be put in front of stake holders for immediate feedback. The Tableau dashboard created a more real time view of their data as an aggregate with the ability to drill down into the details. The solution supports users in providing a single simple to use interface to get all the information they need in one place, instead of having to interrogate multiple systems and emails when they are alerted to issues. By having all the data in one place and shown visually the dashboards allow for specified exceptions, like projected negative inventory, to be called out in time for the users to take action. The Tableau offering has a very slick interface that contributes to the overall goal of having an addictive interface to help facilitate user adoption.
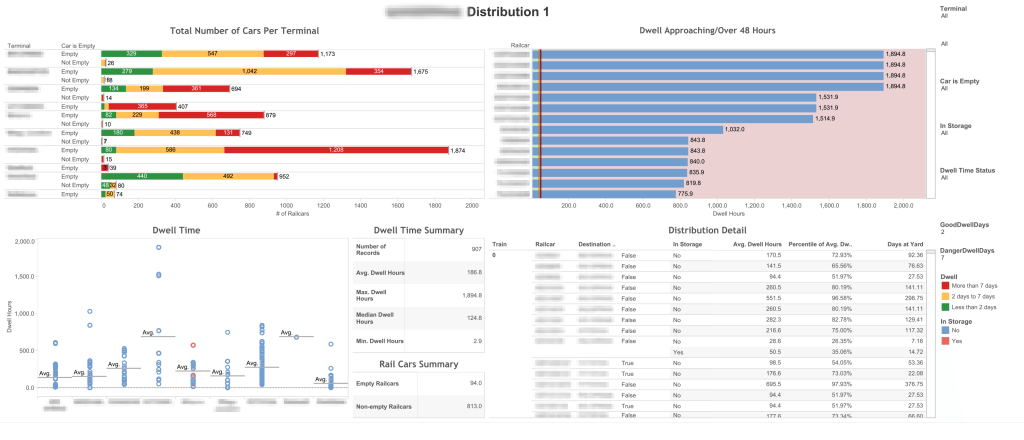
The dashboard shows details about rail cars at given locations—what terminal they are at, for how long they’re there, and whether that exceeds the expected turnaround time.
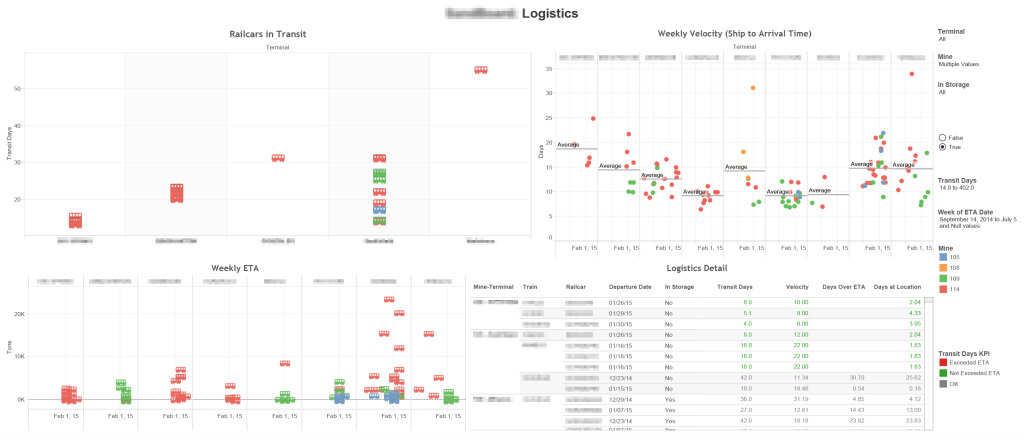
The dashboard shows details about the rail cars in transit—where they are going, how long it takes to get there, how fast they’re moving.
KEY BENEFITS
The portal solution provides the following features to the business users:
- Single go-to location for day-to-day operational data needs.
- Self-service viewing of the defined Key Performance Indicators (KPIs).
- Self-service viewing of clear and concise high-level interactive dashboards.
- Enabling users to subscribe to reports.


